Email Erosion: List of Sample charts
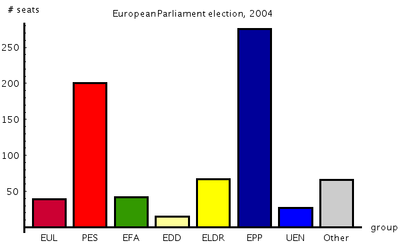
Bar Chart
A bar chart, also known as a bar graph, is a chart with rectangular bars of lengths usually proportional to the magnitudes or frequencies of what they represent. The bars can be horizontally or vertically oriented.
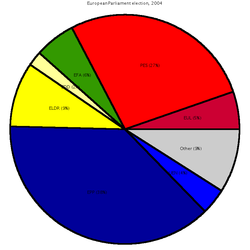
Pie chart
A pie chart is a circular chart divided into sectors, illustrating relative magnitudes or frequencies.
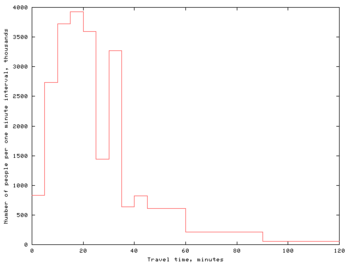
Histogram
A histogram is a graphical display of frequencies. It is the graphical version of a table showing the proportion of cases that fall into different specified categories.
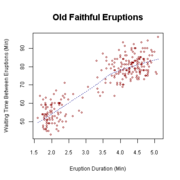
Scatterplot
A scatterplot is a graphical display of the association between two or more variables. It is usually done in a coordinate system with two axis with one variable on the x-axis and another on the y-axis. Dots are used to indicate intersections of data on the two axes, making a visual comparison of the two sets of data that can help to determine relationships between them.